library(tidyverse)
library(gapminder)Exploring Global Development with Gapminder and R
In this post, I explore how life expectancy and GDP per capita differ across continents using the Gapminder dataset.
Data source: Gapminder
License: Creative Commons Attribution (CC BY)
Attribution: Based on free material from GAPMINDER.ORG, CC-BY LICENSE.
First, I look at countries with the highest life expectancy in 2007.
filtered_gapminder <- filter(gapminder, year == 2007)
filtered_gapminder |>
  arrange(desc(lifeExp)) |>
  select(country, continent, lifeExp, gdpPercap) |>
  head(10)
# A tibble: 10 × 4
country continent lifeExp gdpPercap
<fct> <fct> <dbl> <dbl>
1 Japan Asia 82.6 31656.
2 Hong Kong, China Asia 82.2 39725.
3 Iceland Europe 81.8 36181.
4 Switzerland Europe 81.7 37506.
5 Australia Oceania 81.2 34435.
6 Spain Europe 80.9 28821.
7 Sweden Europe 80.9 33860.
8 Israel Asia 80.7 25523.
9 France Europe 80.7 30470.
10 Canada Americas 80.7 36319.The countries with the highest life expectancy in 2007 were mostly in Asia and Europe.
Next, I calculate the average life expectancy and GDP per capita for each continent.
filtered_gapminder |>
  group_by(continent) |>
  summarise(
    life_exp = mean(lifeExp),
    gdp_per_capita = mean(gdpPercap)
  )
# A tibble: 5 × 3
continent life_exp gdp_per_capita
<fct> <dbl> <dbl>
1 Africa 54.8 3089.
2 Americas 73.6 11003.
3 Asia 70.7 12473.
4 Europe 77.6 25054.
5 Oceania 80.7 29810.The results show considerable differences between continents in both economic conditions and life expectancy.
Finally, I visualize the relationship between GDP per capita and life expectancy.
filtered_gapminder |>
  ggplot(aes(
    x = gdpPercap,
    y = lifeExp,
    colour = continent
  )) +
  geom_point() +
  scale_x_log10() +
  labs(
    title = "GDP and Life Expectancy in 2007",
    x = "GDP per capita",
    y = "Life expectancy"
  ) +
  theme_minimal()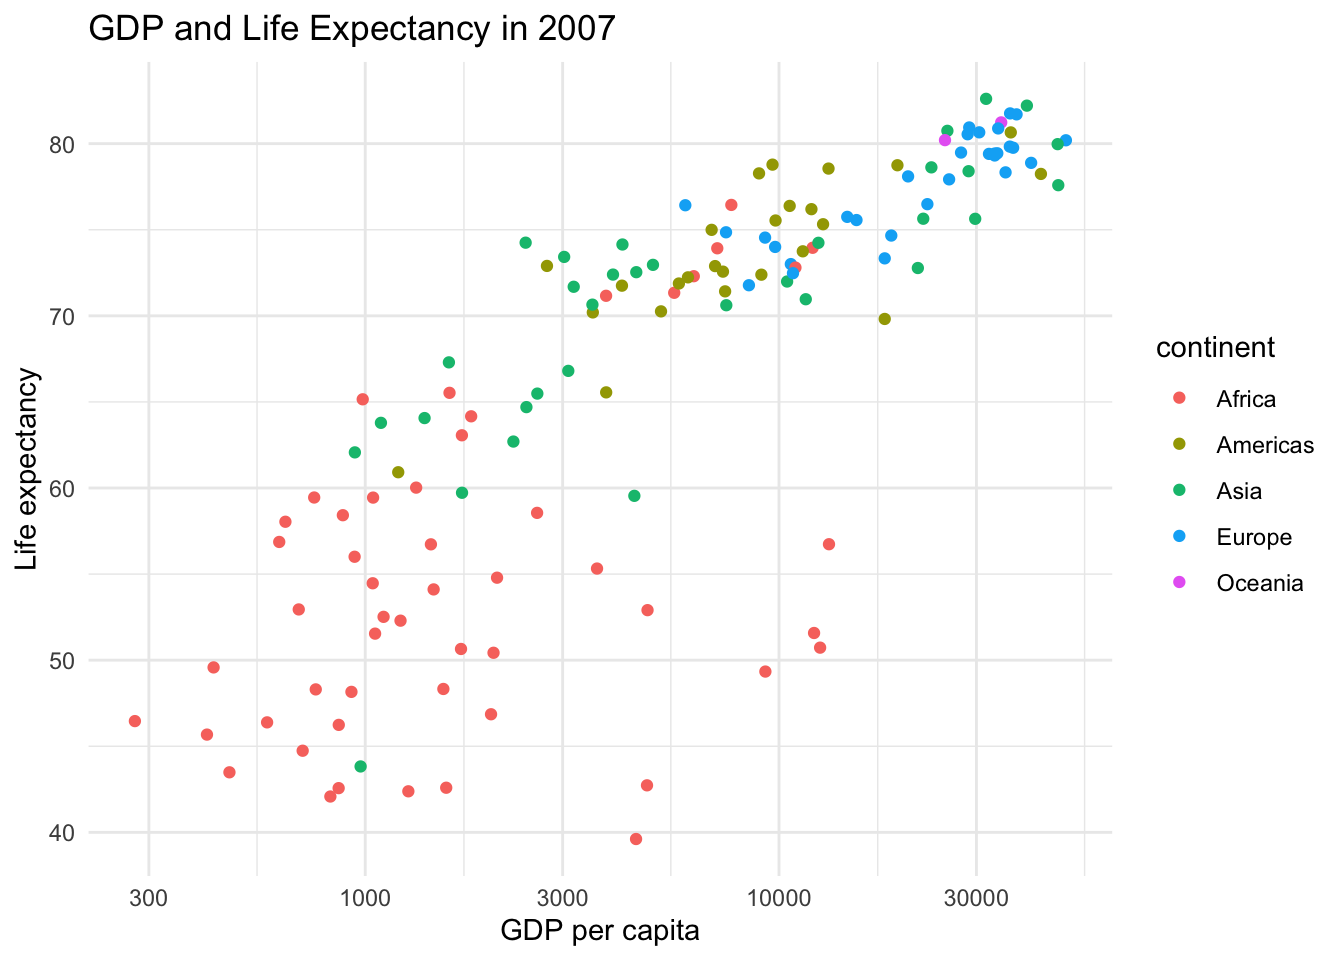
Countries with higher GDP per capita generally have higher life expectancy. However, the relationship becomes less pronounced among wealthier countries, suggesting that increases in income are not associated with equally large increases in life expectancy at all income levels.